Author: Jakub Koníček

Jakub Koníček is an Assistant Professor in the Department of Geoinformatics at the Faculty of Science, Palacký University Olomouc. His expertise includes Geographic Information Systems (GIS), digital cartography, and visual communication. He specializes in geovisualization, data visualization, infographics, and visual storytelling across various interdisciplinary fields. He can be contacted at jakub.konicek@upol.cz.

Format: Co-Creating Visual Communication as a Strategic Tool for Policy Making

Description

Visual communication plays a critical role in contemporary policy making by enabling the clear, efficient, and inclusive interpretation of complex data and analytical outputs. In public administration, decision-making processes increasingly rely on large volumes of heterogeneous data produced by national ministries, regional authorities, municipalities, research institutions, and private entities. However, these data are often presented in highly technical, textual, or tabular formats that limit their accessibility and practical usability for policymakers, stakeholders, and the general public.

Visual communication bridges this gap by transforming complex datasets and analytical results into intuitive, comprehensible, and actionable visual forms such as dashboards, maps, infographics, and interactive reports. In the context of policy making, visualisation supports both communication to policymakers (evidence provision, scenario comparison, impact assessment) and communication from policymakers (policy explanation, transparency, accountability, and public engagement).

Universities play a key role in this process by contributing methodological expertise in data analysis, cartography, data visualisation, user experience and user design, and cognitive aspects of information perception. Through structured cooperation between public administration and academic experts, visual communication becomes not merely a design add-on, but a strategic instrument supporting informed, transparent, and participatory governance.


Objectives

The main objectives of this format are to:

  • Translate complex policy-relevant data into clear and understandable visual narratives tailored to different target groups (policymakers, experts, citizens).
  • Improve comprehension, interpretation, and responsible use of data produced by public administration, academia, and the private sector.
  • Support evidence-based decision-making by enabling rapid comparison of scenarios, trends, and policy impacts.
  • Increase transparency and trust in public institutions through open, well-explained visual outputs.
  • Promote the reuse and opening of public data by embedding visualisation within open data strategies.
  • Strengthen long-term cooperation between universities and public authorities in the field of applied data communication.

How does the format work?

This format is based on systematic collaboration between data producers, policy users, and academic experts specialising in visual communication. The cooperation typically starts with identifying policy-relevant questions or decision-making needs and continues through the entire data lifecycle—from data preparation to final visual outputs.

A common implementation pathway includes:

  1. Problem definition

    Policymakers, together with domain experts, define key policy questions, target audiences, and decision contexts. Defining the process could start with personal/online meeting between policymakers and researchers, where all tasks are defined. The following processes could be managed through regular hybrid meetings, email reports or through shared documents.

  2. Data preparation and assessment

    Public administration provides relevant datasets, while university experts assess data quality, completeness, and analytical potential.

  3. Visualisation design

    Academic teams propose suitable visualisation methods (e.g. maps, timelines, dashboards, comparative charts) aligned with cognitive principles and user needs.

  4. Iterative development

    Visual outputs are refined through feedback loops involving policymakers and communication specialists.

  5. Publication and dissemination

    Results are published via official websites, open data portals, policy reports, social media, or public presentations.

More advanced implementations may result in comprehensive online data portals that combine interactive visualisations, explanatory texts, downloadable datasets, and methodological documentation. These platforms allow users to explore information at different levels of detail—from high-level summaries to raw data—while remaining compliant with European open data principles and interoperability standards.


Challenges (and ways to address them)

Limited availability of skilled professionals
Solution: Establish long-term partnerships with universities and involve students and researchers through applied courses, internships, or project-based collaboration.

Insufficient data quality or coverage
Solution: Introduce data quality standards and iterative validation processes involving both data producers and analysts.

Inappropriate or misleading visualisation choices
Solution: Apply established visualisation guidelines and ensure expert review by specialists in data perception and cartography.

Financial constraints
Solution: Integrate visual communication activities into existing projects, grants, or strategic development programmes rather than treating them as standalone costs.

Capacity limitations within public administration
Solution: Combine in-house expertise with external academic support and provide targeted training for public-sector staff.

Tasks and resources

Public Administration

  • Define policy questions and communication objectives.
  • Provide access to relevant datasets and contextual knowledge.
  • Ensure alignment with legal, strategic, and institutional frameworks.

Researchers

  • Analyse data and propose appropriate visual communication methods.
  • Design and develop visual outputs and explanatory materials.
  • Provide consultations, training, and methodological guidance.

Knowledge Exchange and Communication Officers

  • Facilitate cooperation between institutions – formal/informal discussion between researchers and chosen officers competent in given subject area – in-person/virtual meeting, round table discussion.
  • Support dissemination, public outreach, and stakeholder engagement.


Required funding for activities

  • No additional funding is required for routine data preparation conducted as part of public administration’s standard agenda.
  • Financial resources may be required for:
    • University staff time dedicated to advanced analysis and visual design.
    • Development of interactive tools or digital platforms.
  • Purely consultative involvement of academic experts typically falls within their standard professional responsibilities and may not require extra funding.


Example

Case: Regional Open Data and Visualisation Portal

A regional open data and visualisation portal was developed following an initiative by a university department specialising in geoinformatics and data visualisation – Department of Geoinformatics at Palacký University Olomouc and the Olomouc region. The project began with an analytical study assessing the current state of data availability and visual communication practices within the region.

University experts prsepared a set of strategic recommendations and proposed a visual framework aligned with international best practices. Following financial support from the regional authority, the portal was implemented as an interactive online platform combining thematic dashboards, maps, explanatory texts, and access to raw datasets.

Throughout the development process, continuous consultation, training sessions, and expert support were provided to regional staff. The resulting portal became one of the first comprehensive open data visualisation platforms in the country and now serves as a reference example for other regions.

Portal is available on https://www.dataok.cz/.


Do you want to know more about the policy engagement toolkit?

Do you want to share your experience in policy engagement? Do you think about contributing to the policy engagement toolkit? Feel free to contact Tome Sandevski via science-policy@pvw.uni-frankfurt.de
How to support citizen science (geoparticipation) by modern digital methods and frameworks

Description

Geoparticipation in the context of citizen science represents a specific group of participatory methods that enable the public to actively contribute to the collection of spatially explicit data through digital map‑based interfaces. In both Czech and international practice, this approach is most commonly implemented through so‑called emotional (participatory) mapping, in which respondents record their experiences, opinions, or subjective perceptions of specific places directly into a map using points, lines, or polygons. These spatial inputs are typically supplemented with textual descriptions, photographs, comments, or predefined thematic categories.

The collected data are subsequently processed using standard Geographic Information Systems (GIS) workflows, including data cleaning, aggregation, spatial analysis, and visualization. A wide range of visualization techniques can be applied to emotional mapping data; however, digital cartographic methods such as heat maps, aggregated visualizations using hexagonal grids of varying resolutions, cartograms, cartodiagrams, or clustering techniques are most commonly used to facilitate interpretation of results by end users.

Unlike conventional questionnaire surveys, geoparticipation captures not only respondents’ opinions but also their precise spatial location associated with each response. This makes the method particularly suitable for topics where spatial context is essential, such as transportation, safety, quality of public spaces, environmental issues, or spatial and urban development. In practice, geoparticipation is often implemented as an extension of a traditional questionnaire enriched with spatial questions.

The method is not intended to produce statistically representative samples but rather to serve as a targeted participatory survey whose main value lies in identifying specific locations and issues that are typically absent from administrative datasets or difficult to detect through conventional means. The collected responses provide valuable supporting evidence for municipal and regional authorities when making strategic decisions informed by public opinion.

The key features in a nutshell

The fundamental characteristic of geoparticipation is the active involvement of citizens in the collection of spatial data through a simple map‑based application. The method supports mapping of points, lines, and polygons, with each spatial entry accompanied by a textual comment and, where applicable, a predefined thematic category specified by the research designer.

Geoparticipation can be used as a standalone research tool or as an extension of a traditional questionnaire by adding a spatial dimension. It is applicable across diverse respondent groups and, due to its intuitive design, is suitable for both technically skilled users and lay participants without advanced IT knowledge. Data collection can take place entirely online via a publicly accessible map application or directly in the field using tablets or mobile phones under the guidance of trained facilitators.

Typical topics include perceived safety and fear, positively and negatively perceived places, proposals for urban development (parks, playgrounds, greenery, benches), problematic traffic situations, noise, pollution, or parking issues. The method enables the collection of data that are otherwise largely unavailable and creates an important bridge between expert planning practices and the everyday experiences of residents.


How does the format work?

Implementing a geoparticipatory mapping project requires careful preparation of the methodology, technical solution, and survey questions. Equally important is the selection of the mapping location and the target group of respondents. A key methodological decision concerns the choice of geometry type—whether respondents will map only points or also lines and polygons. While point mapping is user‑friendly and efficient, lines and polygons allow for more precise representation of phenomena but place higher demands on user orientation and subsequent data processing.

The selection of an appropriate base map is equally critical. In some cases, orthophotos are preferable, while in others topographic maps or detailed urban plans are more suitable. An inadequately chosen base map can significantly reduce the quality of the mapped data. Each mapped feature should include a mandatory description and ideally a thematic category to facilitate later analysis, as spatial clicks without contextual information have limited interpretative value.

It is recommended to use widely familiar map backgrounds to ensure respondents feel comfortable using an interface similar to everyday map applications.

Geoparticipation is best combined with a short non‑spatial questionnaire integrated into the same tool. This usually includes questions on overall satisfaction with the topic and basic sociodemographic information (e.g., age, gender). In some cases, information about the respondent’s place of residence is also collected, typically in a partially anonymized form (such as city district or street), to distinguish between local residents and visitors to the area.

From a technical perspective, only a limited number of tools currently support geoparticipation. Basic scenarios can be implemented using tools such as Survey123; however, more complex logic usually requires the development of a custom solution. While specialized PPGIS platforms are used internationally, none offer a universally applicable solution. In exceptional cases, digital data collection may be supplemented by paper‑based methods (e.g., for seniors or young children), although subsequent data integration is both methodologically and technically demanding.

In the Czech Republic, a specialized company (https://www.pocitovemapy.cz/) develops and implements customized web environments tailored to specific formats, locations, and thematic requirements.


Role of Participants

The academic sector typically ensures methodological design, selection of technical solutions, configuration of the mapping application, and subsequent data processing and evaluation using GIS. Its role also includes interpretation of results and preparation of outputs understandable to both public authorities and the general public.

Municipalities or regions define the thematic focus, specify practical decision‑making questions, and ensure communication with citizens, particularly through promotion of data collection via websites and social media. Citizens contribute local knowledge and experiences that are not available in official datasets. In some cases, targeting specific population groups—such as primary school children when mapping safe routes to school—can be particularly beneficial.

In general, the greater the number and diversity of responses collected within a given area, the more robust and valid the results can be considered.


Benefits for participations

The principal benefit of geoparticipation lies in its ability to generate unique spatial data that are otherwise largely unavailable. The collected data represent respondents’ opinions linked to precise spatial locations. A higher concentration of responses in a given location increases the credibility of the findings.

The method enables precise localization of problems and their qualitative description directly from the perspective of residents. For public authorities, geoparticipation represents a fast and flexible tool for identifying priorities and local issues. For academia, it offers significant opportunities for applied research and collaboration with public administration. Students benefit from working with real‑world data and participating in projects with direct practical impact.


Challenges (and ways to address them)

A fundamental limitation of geoparticipation is the non‑representative nature of the respondent sample and the risk of collecting a low number of responses. Results must therefore be interpreted as exploratory rather than statistically representative. This limitation can be partially mitigated through targeted promotion and involvement of local institutions.

Additional challenges include the technical and methodological complexity of project preparation, particularly when developing custom solutions, as well as issues related to data privacy and anonymization when combining spatial and personal information.


Tasks and Resources

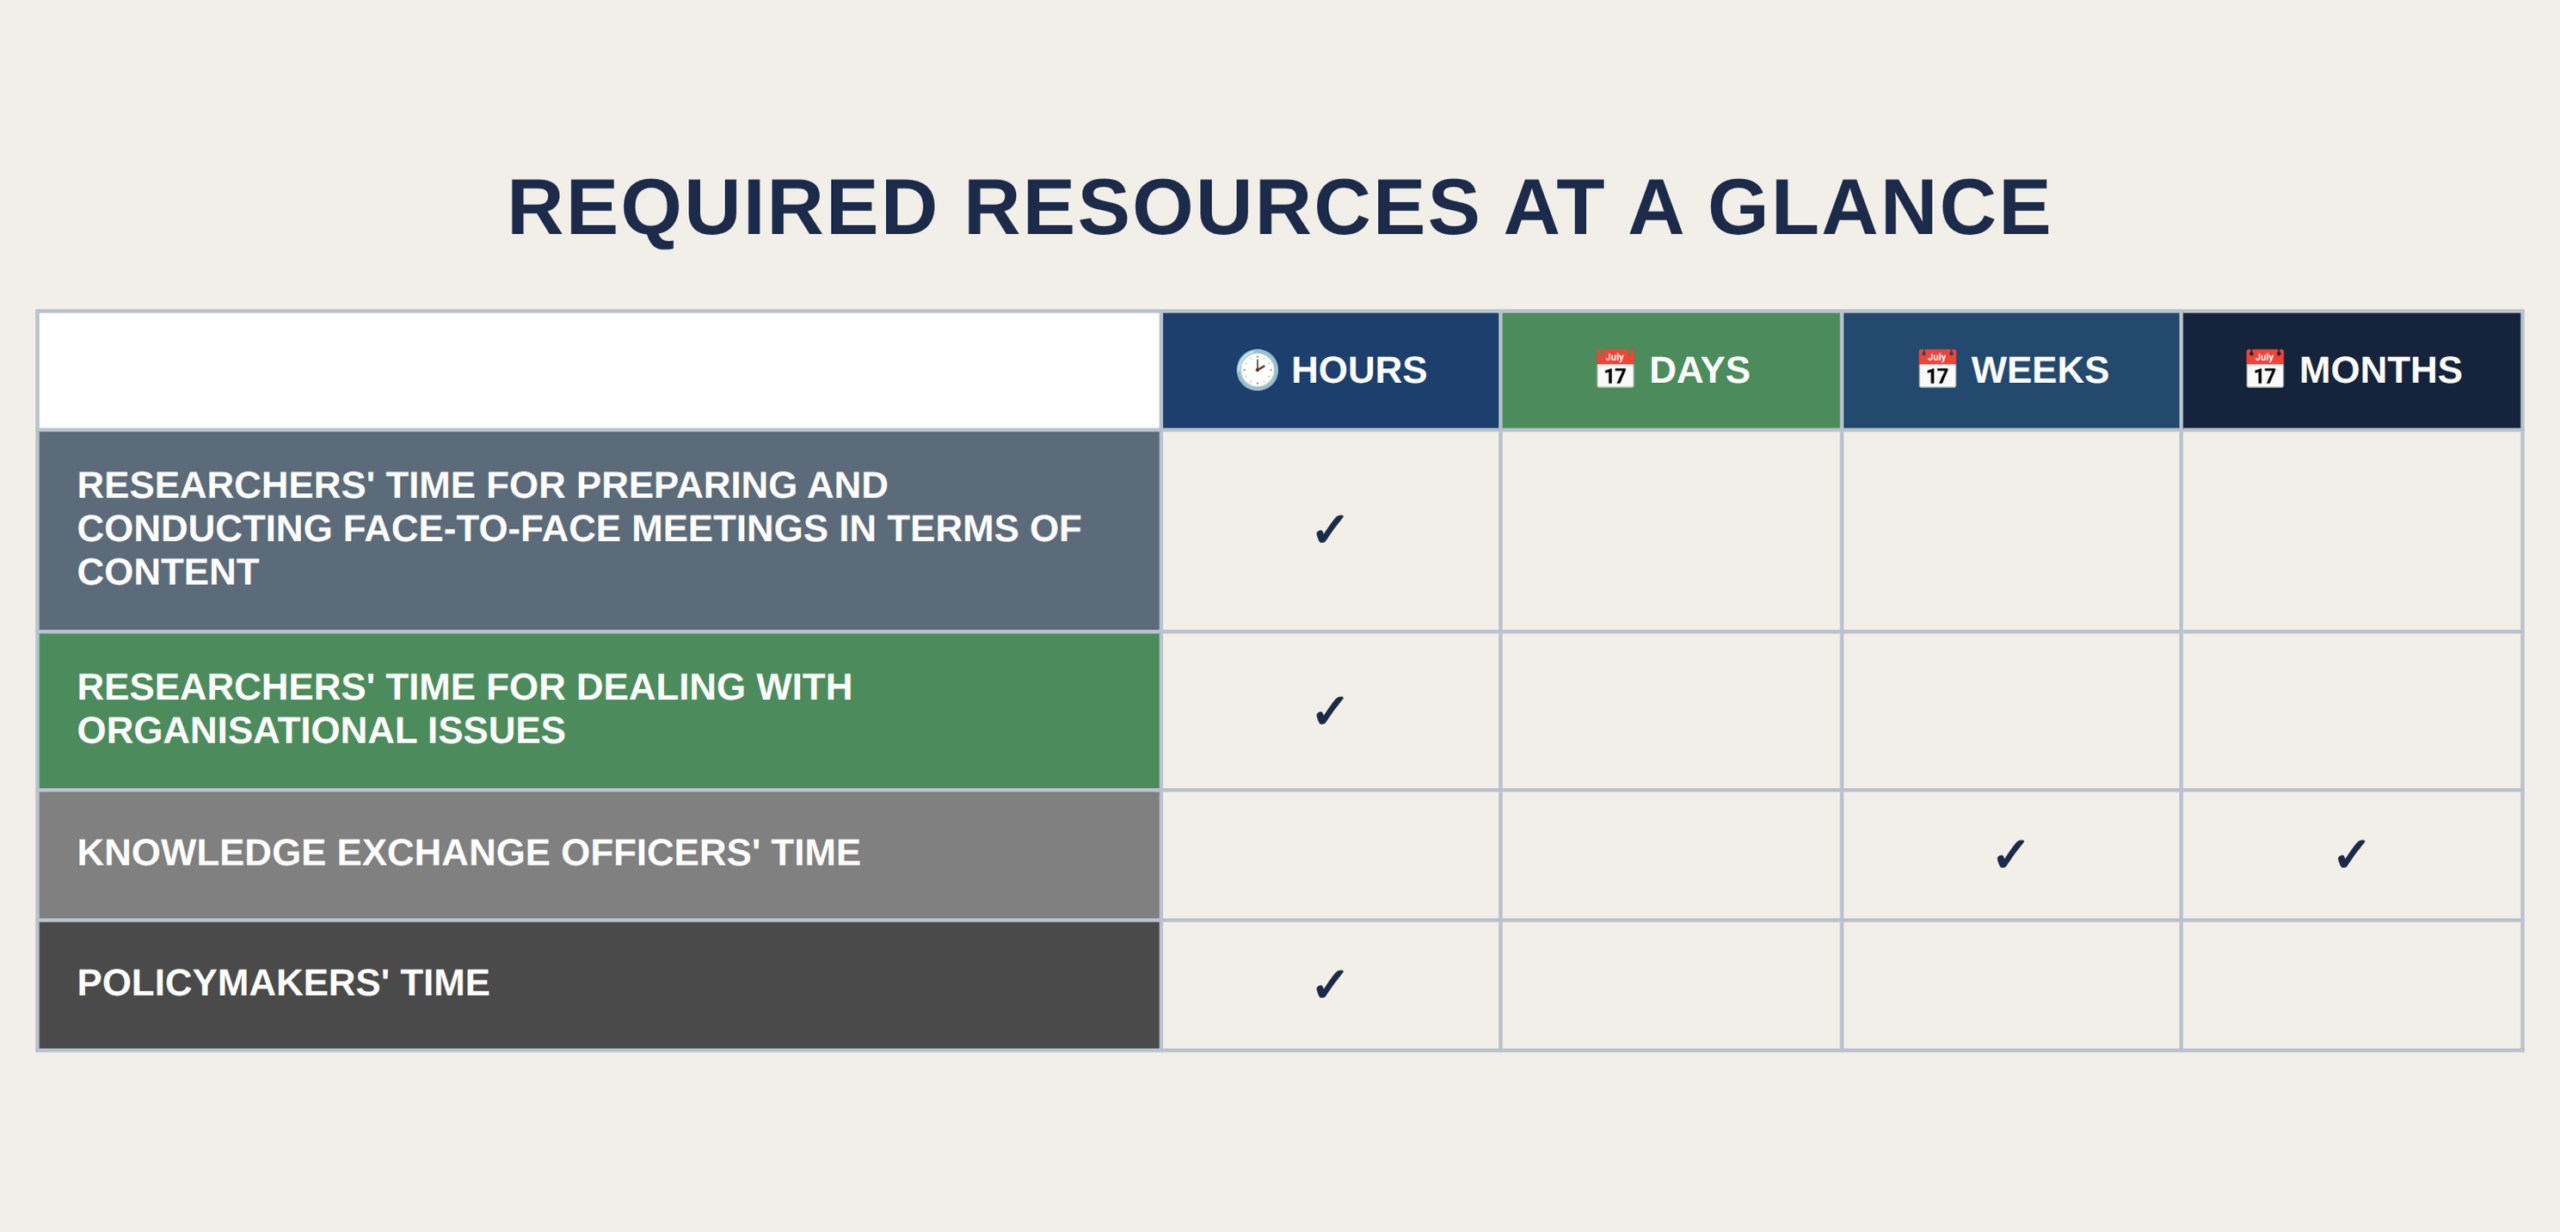
Geoparticipatory projects are both time‑ and expertise‑intensive. Preparation typically takes approximately one month, data collection another month, and evaluation at least one month. The overall project duration therefore usually spans around three months.

In terms of funding, geoparticipation is most commonly implemented through contractual research or close collaboration with municipalities. Universities are generally unable to provide such services free of charge, as they require experienced teams and adequate technical infrastructure.


Example

In recent years, Palacký University Olomouc has implemented a number of geoparticipatory projects, including mapping urban temperature phenomena in the city of Olomouc, monitoring mosquito occurrence in the Litovelské Pomoraví Protected Landscape Area, emotional maps of perceived fear, and the Safe Route to School project focusing on problematic traffic situations from the perspective of primary school children. Additional public outputs are available through specialized web portals dedicated to emotional mapping in the city of Olomouc.


Do you want to know more about the policy engagement toolkit?

Do you want to share your experience in policy engagement? Do you think about contributing to the policy engagement toolkit? Feel free to contact Tome Sandevski via science-policy@pvw.uni-frankfurt.de
Shadowing Sessions

Definition

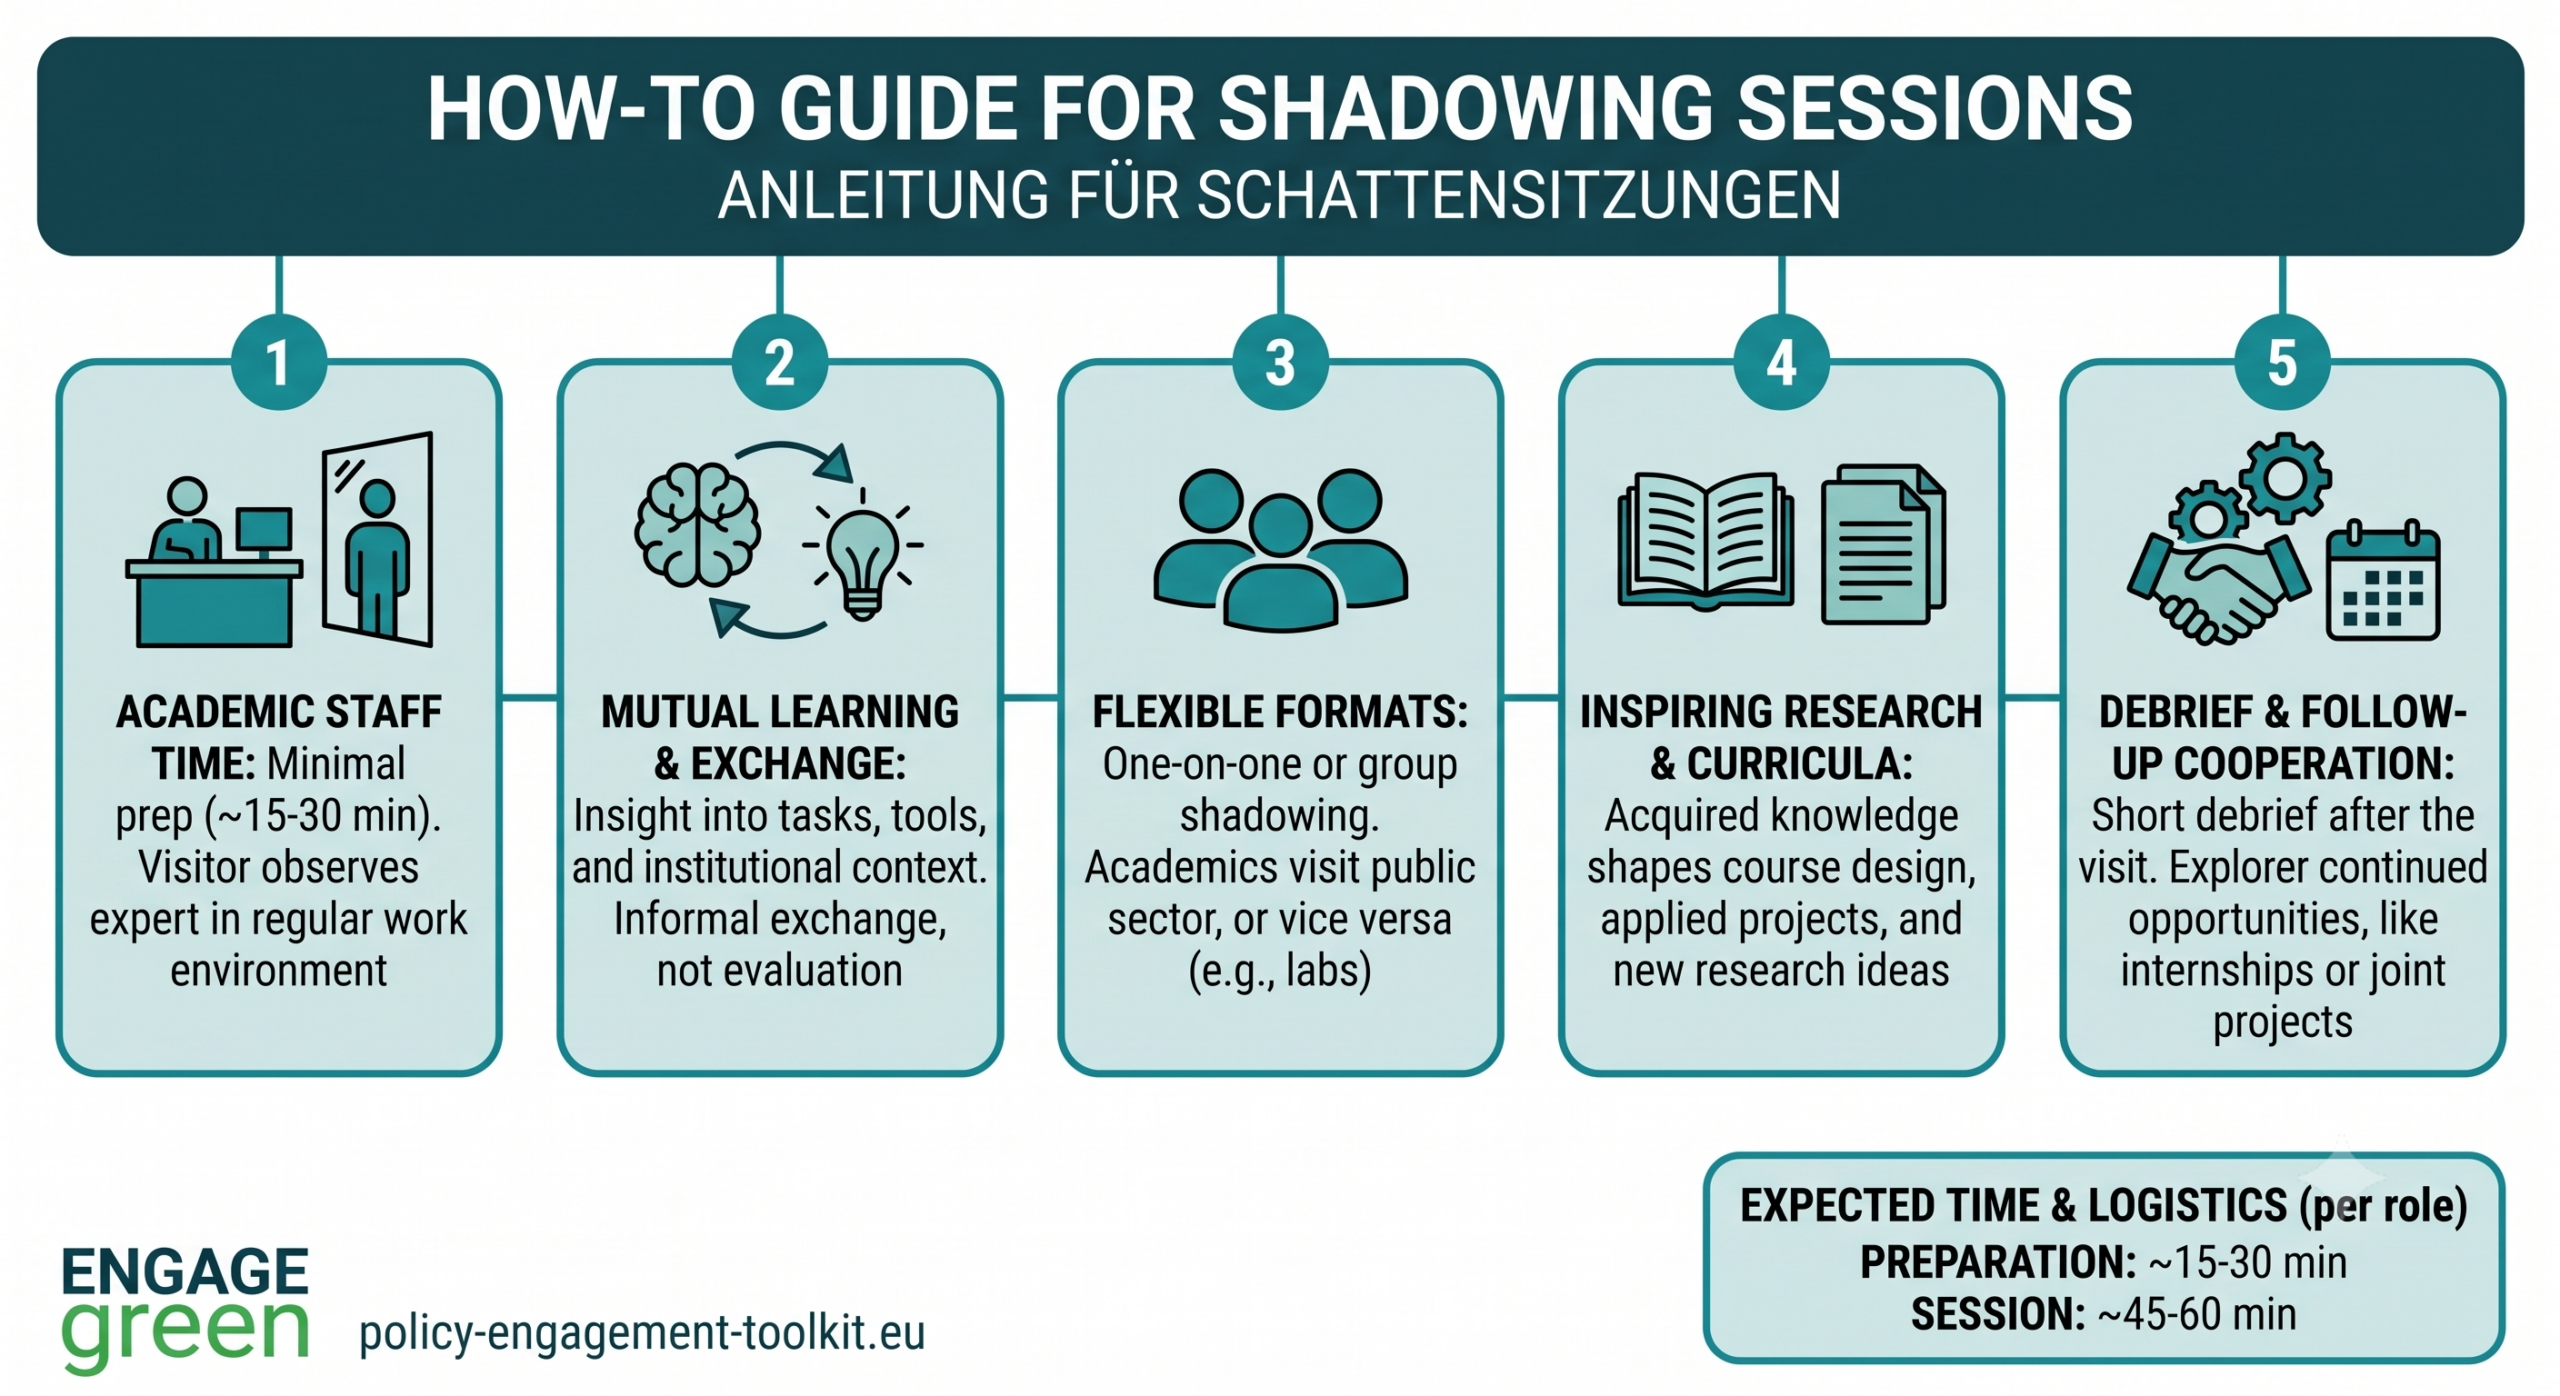
A shadowing session is a structured observational activity where a visitor follows a professional in their regular work environment to gain insight into their responsibilities, workflows, tools, and institutional context. The primary objective is mutual learning and knowledge transfer between academia and practice, without the formal constraints of internships or evaluations.


Description

Experiential observation for mutual understanding and content innovation


Objectives

– Foster long-term collaboration between universities and public-sector stakeholders.
– Align university curricula with the actual needs of the public sector.
– Enhance the employability of graduates by providing realistic insights into public administration roles.
– Facilitate mutual knowledge exchange through observation and informal consultation.
– Support public innovation by incorporating up-to-date academic knowledge into policy-making and administrative practices.


How Does the Format Work?

Shadowing sessions are structured visits where academics observe public administration experts—such as data analysts, planners, or specialized officers—in their day-to-day work. The primary purpose is not evaluation, but rather mutual learning. Academics gain firsthand knowledge of professional tasks, tools, workflows, and expectations. This knowledge can then inform curriculum development or shape applied research and project collaboration. The concept of shadowing sessions can also be viewed oppositely, where representatives from public administration visit practice-based academics or researchers in their labs. Although senior policy-makers may not have the capacity to be shadowed due to their schedules, mid-level professionals or practical-oriented officers are ideal participants. These individuals can demonstrate daily tasks such as spatial analysis, permit workflows, data management, or participatory processes. In some cases, group shadowing is used: one public officer performs their tasks while multiple academics observe, followed by a structured discussion.

For academics, shadowing provides:
– Insight into real-life workflows, administrative constraints, and data usage in public institutions
– Access to specialized tools, data systems, or archives that would otherwise remain closed.
– Inspiration for research questions with real-world relevance.

For public-sector experts, shadowing offers:
– A channel to communicate current challenges, outdated processes, or staffing needs.
– Opportunities to influence the competencies of future graduates.
– Feedback on how university teaching and research can support innovation and modernization.


Duration and Logistics

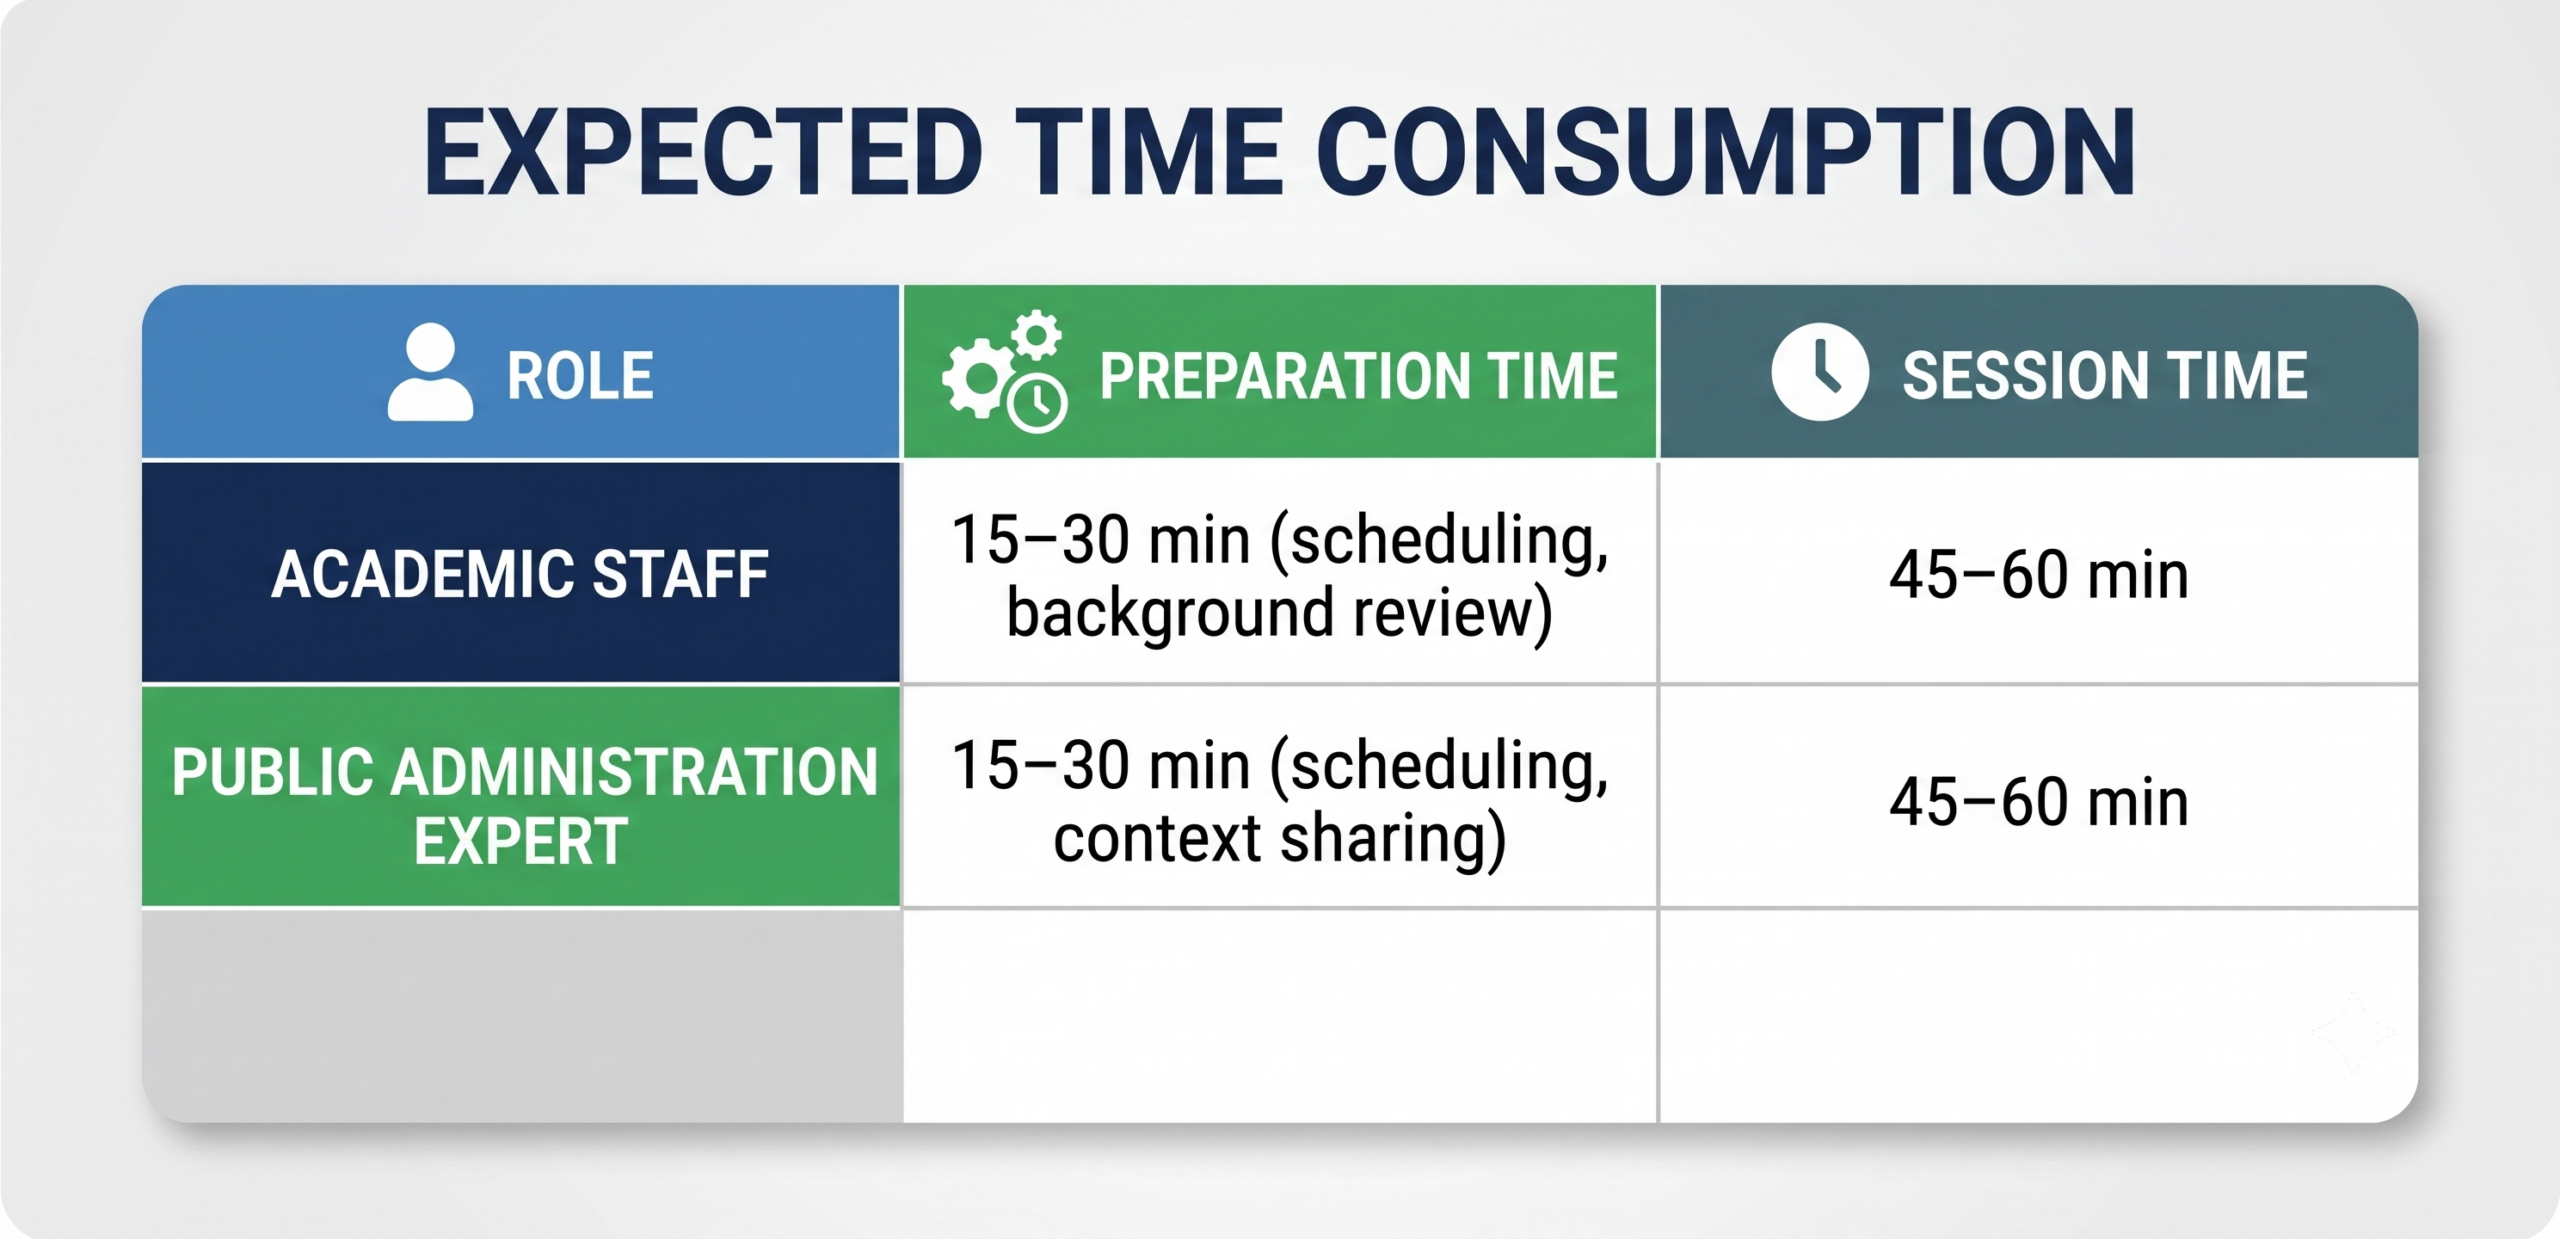
– Typical length: 45–60 minutes
– Format: In-person visit (one-on-one or one-to-many)
– Preparation required: Minimal—informal discussions among experts in similar fields suffice
– Recommended follow-up: Short debrief and opportunities for continued cooperation (e.g., internships, joint projects)


Challenges and Opportunities

While shadowing sessions offer great benefits, they are time-intensive to schedule and organize. Finding mutually convenient times for all participants can be difficult. However, the low-cost and high-impact nature of these interactions makes them worthwhile. Regular shadowing sessions can also serve as a feedback loop—enabling public institutions to revise recruitment criteria and universities to keep curricula aligned with evolving needs.


Benefits for Both Sectors

Academics benefit from:
– A better understanding of how processes are applied in local governance.
– Inspiration for course design, applied student projects, and research ideas.
– Access to real data, software, and institutional know-how.

Public-sector institutions benefit from:
– Influencing academic training to meet real labor market demands.
– Finding new ways to modernize workflows using up-to-date academic methods.
– Building relationships that support recruitment, internships, and project cooperation.

Do you want to know more about the policy engagement toolkit?

Do you want to share your experience in policy engagement? Do you think about contributing to the policy engagement toolkit? Feel free to contact Tome Sandevski via science-policy@pvw.uni-frankfurt.de
Hackathon: When Data Speaks

Description

The “When Data Speaks” Hackathon is a collaborative innovation event designed to connect the academic world with public administration and the technical community. Taking place over several days, it focuses on using data to improve the quality of life in the region. The event serves as a platform where students, IT professionals, and enthusiasts work together to solve specific regional challenges defined by local stakeholders.


Objectives

The primary goals of this initiative are to:

  • Connect diverse sectors: Build active partnerships between researchers, city officials, and technology students or experts.
  • Apply open data: Leverage public datasets to address concrete problems identified in the region.
  • Create practical solutions: Generate functional prototypes, analytical tools, or concepts that support regional governance and environmental sustainability.
  • Enhance decision-making: Demonstrate how data-driven insights can be integrated into public policy and community engagement.


How does the format work?

This format acts as an accelerator for innovation by bringing distinct groups together in a shared space. Unlike traditional meetings, it combines the technical skills of developers with the strategic needs of policymakers to produce immediate, tangible results. The core element is the use of “open data,” which ensures transparency and allows participants to build solutions using resources that are freely available to the public. It is also a learning experience, offering participants a chance to understand the intersection of technology and public administration.

The event typically spans 48 hours of intensive collaboration.

  • Participant recruitment: Participant recruitment combined broad outreach with targeted engagement to ensure a diverse pool of attendees. Organisers promote the hackathon through presentations at high schools, social media posts, institutional newsletters, and paid as well as organic advertisements on partners’ social network channels. Additionally, individual and personal invitations were sent to select students, professionals, and stakeholders with relevant expertise. The call for participation was further disseminated within scientific networks and partner communities, helping to attract motivated participants from academia, industry, and the public sector while fostering interdisciplinary collaboration.
  • Kick-off and Context: The event begins with an opening session where organizers present the specific challenges (e.g., traffic monitoring, climate resilience) and introduce the available datasets.
  • Education and Training: Participants attend workshops and lectures to learn about the data sources and relevant tools.
  • Teamwork and Development: Participants form interdisciplinary teams and select a problem to solve. They spend the majority of the time analysing data, coding, and building a proof of concept.
  • Mentoring: Experts from the city, university, and private sector act as mentors, guiding teams to ensure their solutions are technically sound and practically useful.
  • Evaluation: At the conclusion, teams present their prototypes to a jury of stakeholders. Projects are judged on their innovation, feasibility, and potential impact on the region.


Challenges (and ways to address them)

  • Resource Constraints for Organizers: Scientists often face difficulties balancing research duties with the logistics of event planning. Solution: Assign logistical tasks, such as venue management and registration, to support staff or student assistants.
  • Applicability of Results: Policymakers may worry that technical outputs will not fit existing legal or administrative frameworks. Solution: Involve officials directly in defining the challenges to ensure alignment with policy needs from the start.
  • Funding and Engagement: Securing budget and maintaining participant energy can be difficult. Solution: Build a coalition of diverse partners to share costs and provide varied expertise.


Tasks and resources

Researchers/Scientists:

  • Responsible for the content strategy: defining the challenges, curating datasets, and setting the agenda.
  • Manage the selection of mentors to guide the technical aspects.

Policymakers:

  • Identify pressing regional issues that can be solved with data.
  • Secure necessary funding through grants or partnerships and ensure the event aligns with strategic political goals.
  • Plan for the future implementation of successful prototypes.

Support Staff:

  • Manage operational logistics, including venue booking, catering, and participant registration.
  • Handle communication, such as social media promotion and press releases.


Required funding for activities

A successful event requires budget allocation for:

  • Operational Costs: Venue rental, catering for attendees, and technical infrastructure.
  • Personnel Expenses: Travel and accommodation for external experts, mentors, and speakers.
  • Incentives: Prizes for winning teams and marketing materials to ensure high visibility and attendance.


Do you want to know more about the policy engagement toolkit?

Do you want to share your experience in policy engagement? Do you think about contributing to the policy engagement toolkit? Feel free to contact Tome Sandevski via science-policy@pvw.uni-frankfurt.de

Other